The Top Three Indicators to Watch in This Market
Andy Snyder|May 18, 2021
Investors are growing concerned. They’re worried the markets have topped out and will soon head backward.
Should they be?
Is now the time to be on the sideline, watching the game unfold? Or should we hold our nose and stick to the playbook?
We need to look at just three gauges to know what’s going on… and what to do next.
The “Big” Buyers
The biggest driver of stock market profits over the last 12 years is not what most folks think it is.
With economic growth largely stale (annual GDP growth has yet to eclipse the 2% mark since the ’08 meltdown), the textbooks tell us that stocks, too, should be flat.
But they’re not. Far from it.
That’s because there is a different driver of rising prices… share buybacks.
It’s a taboo subject for most traditionalists. Buybacks are dirty, they say. They’re greedy. They make the rich richer.
These are bogus claims.
Share buyback programs are the corporate world’s answer to a manipulated, zero-interest-rate, go-nowhere economy. They were the biggest driver of rising share prices between 2009 and 2019.
And after nearly a year in hiatus, they’re back in a way we’ve never seen before.
So far this year, there have been more than $500 billion in new buyback plans announced. It’s a fresh record. In a zero-interest-rate world, it’s the best return on capital for Corporate America’s record-smashing $1.9 trillion stockpile.
“We’re buying back stock because our cup runneth over,” Jamie Dimon said last month. His JPMorgan Chase is buying back $30 billion worth of shares.
In our popular subscriber-only newsletter, Manward Letter, we devote an entire allocation of our Modern Asset Portfolio to this notion.
And it’s paid off.
The S&P 500 Buyback Index is outpacing the broader index by 2-to-1 this year.
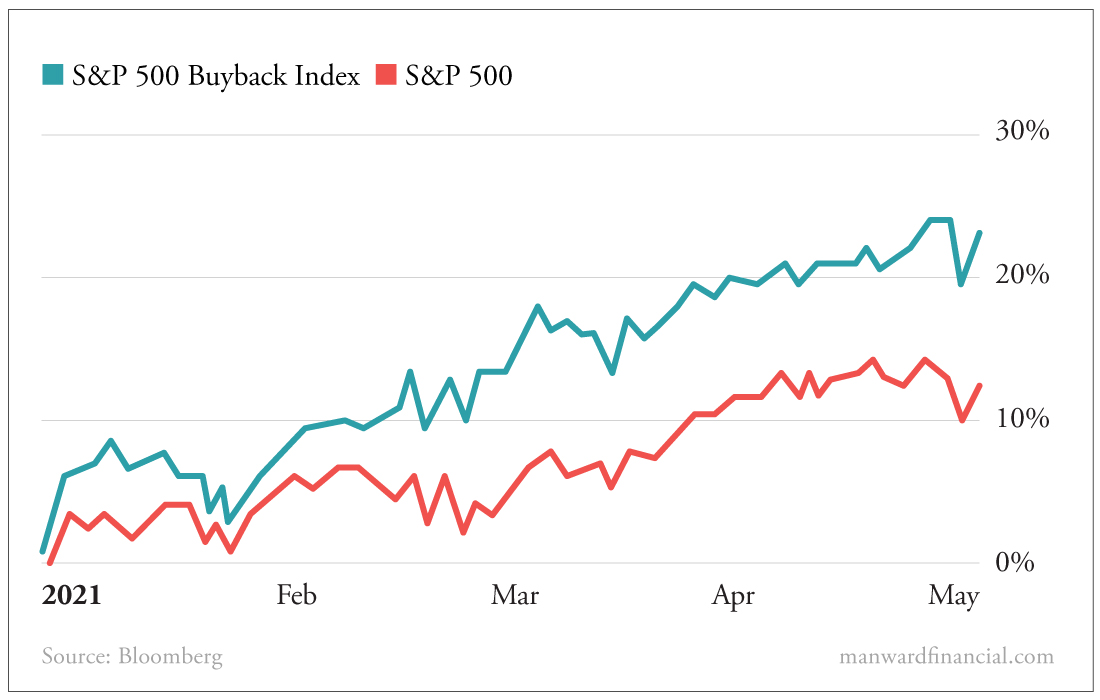
As long as rates stay low, the trend will not only continue… but heat up.
Our first indicator, therefore, is quite bullish.
Paid to Borrow
If you’re reading closely, you’ve noticed that we’ve mentioned interest rates a few times now. Without a doubt, they are the most important metric in all of finance.
Where they go, so goes the world.
And while lots of folks are right to track mainstays like the 10-year Treasury, 30-year mortgages and, of course, the Fed’s fund rate, the best indicator to watch gets far less attention.
It’s at the center of our Modern Asset Portfolio. It’s the “real rate” of the 10-year Treasury.
With all of the money printing and free-money bonanzas of the last year and change, inflation has become a very real threat. None of the other rate gauges take the falling value of the dollar into consideration.
But real rates do.
To find the real rate, we simply subtract the rate of inflation from the 10-year Treasury. And – surprise, surprise – the figure is negative.
That means when we buy a 10-year Treasury – the “safest” bet in all the world – it may pay us a rate of 1.6%… but when we account for the rate of inflation, we’re actually losing money at a rate of 0.88% per year.
Yikes.
These rates, of course, haven’t always been negative.
At the start of 2020, the real rate on the 10-year was 0.08%. But after oodles of inflationary spending and emergency rate cuts, it dipped… bottoming out at -1.08% on January 4 of this year.
As we write this morning, the rate is trending lower again. It’s back to -0.88% after climbing as high as -0.62% in late March.
It’s the change in that number that dictates the market’s long-term direction. Everything else is just day-to-day noise.
Right now, this indicator is mildly bullish. Rising inflation is pulling it down at nearly the same clip as the market and its manipulators are trying to pull it up.
Free Money
We’ll save the suspense on our third indicator. It’s bearish.
There’s little doubt one of the biggest movers of markets over the last 12 months was Uncle Sam and all of his free-money giveaways.
Unless insanity prevails, he’s done for now.
There are still hundreds of billions to hand out, but the market-moving, headline-making announcements of fresh programs are on hold… at least until an addicted market demands more.
From here, investors must interpret the lies, hyperbole and misinformation surrounding two opposing forces – tax hikes and infrastructure spending.
Neither figure will live up to the headline hype.
Washington’s tax hikes won’t be as aggressive as the president promised. And spending will fall even further short.
It’ll give the market plenty to digest and will certainly stir lots of ups and downs. But the free-money giveaways are done for now… which explains why much of the market’s froth has subsided in recent weeks.
Put all three of these gauges together, though, and the outlook is bullish.
Low rates and buybacks will continue to prevail.
That means it’s game on for our Modern Asset Portfolio.

Andy Snyder
Andy Snyder is an American author, investor and serial entrepreneur. He cut his teeth at an esteemed financial firm with nearly $100 billion in assets under management. Andy and his ideas have been featured on Fox News, on countless radio stations, and in numerous print and online outlets. He’s been a keynote speaker and panelist at events all over the world, from four-star ballrooms to Capitol hearing rooms.