Time to Buy Nvidia?
Andy Snyder|August 9, 2021

Wow… you blew us away with your response to last week’s piece on the Liberty Indicator.
We received well over a hundred ticker symbols that you’d like us to examine.
Clearly, we can’t go through each of them in this column, but we are scratching our head and trying to find some technology that could make it possible.
Until then, we’ll cover the most popular stocks amongst readers.
Hands down, Nvidia (NVDA) makes the list. The behemoth graphics card maker is in quite a sweet spot on Wall Street these days. Its products are in huge demand thanks to the technological shifts brought on by COVID-19… and the stock is still blessed with a tailwind thanks to its role in the crypto market.
So is it time to buy NVDA? What does the Liberty Indicator have to say about this popular play?
To review, this gauge is a proven technical indicator that tracks buying and selling pressure. It measures trading volume and compares it with the day’s pricing action. Big volume while prices are rising is a good sign. Big volume while prices are dropping… not so much.
The equation behind the Liberty Indicator pulls 20 days’ worth of moves together and gives us a very accurate feel for the overall market sentiment.
History – and our trading results – proves that the time to buy is when that sentiment changes. A crossover typically precedes a big run in share price.
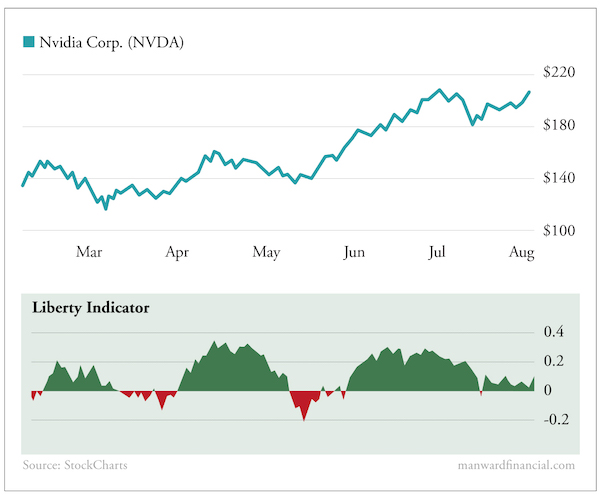
We can see it here in Nvidia’s chart…

Each time the indicator – shown at the bottom of the chart – went from red to green over the last six months, shares ran higher.
The biggest run started at the end of May, when a couple of small crossovers were confirmed by a huge surge in buying pressure.
Shares quickly jumped 60%.
But what about now?
The Liberty Indicator remains green, with the last crossover in mid-July.
With the gauge very near the neutral line and showing a small jump in recent sessions, it’s bullish… but certainly not extremely bullish.
But, looking deeper, the chart reveals a caveat…
With the stock near the top of its recent range and buying activity relatively stale, a short-term pullback is quite possible. If that happens, the indicator will turn red, setting up a great buying opportunity whenever it turns green again.
For short-term traders looking for the very best entry point… it’s best to wait a week and see what happens.
This one has a neutral outlook.
Keep sending the tickers you’d like us to cover to mailbag@manwardpress.com.

Andy Snyder
Andy Snyder is an American author, investor and serial entrepreneur. He cut his teeth at an esteemed financial firm with nearly $100 billion in assets under management. Andy and his ideas have been featured on Fox News, on countless radio stations, and in numerous print and online outlets. He’s been a keynote speaker and panelist at events all over the world, from four-star ballrooms to Capitol hearing rooms.


