Use This Simple but Proven Indicator for Big Rewards
Andy Snyder|June 5, 2023

Where to start?
The other day, we ran into a fella who was looking to do some trading. He was proud that he had his investment accounts where he wanted them. He wasn’t looking for safe, long-term plays. Those were set.
He wanted to trade.
Knowing what we do for a living, he came to us looking for some pointers.
Longtime readers likely know where we sent him. We’ve long believed that trading volume is the first stop for any short-term investment decision.
Take a look at this image from our pals at Finviz. It shows the relative volume of every stock in the S&P 500. It’s a magical thing…
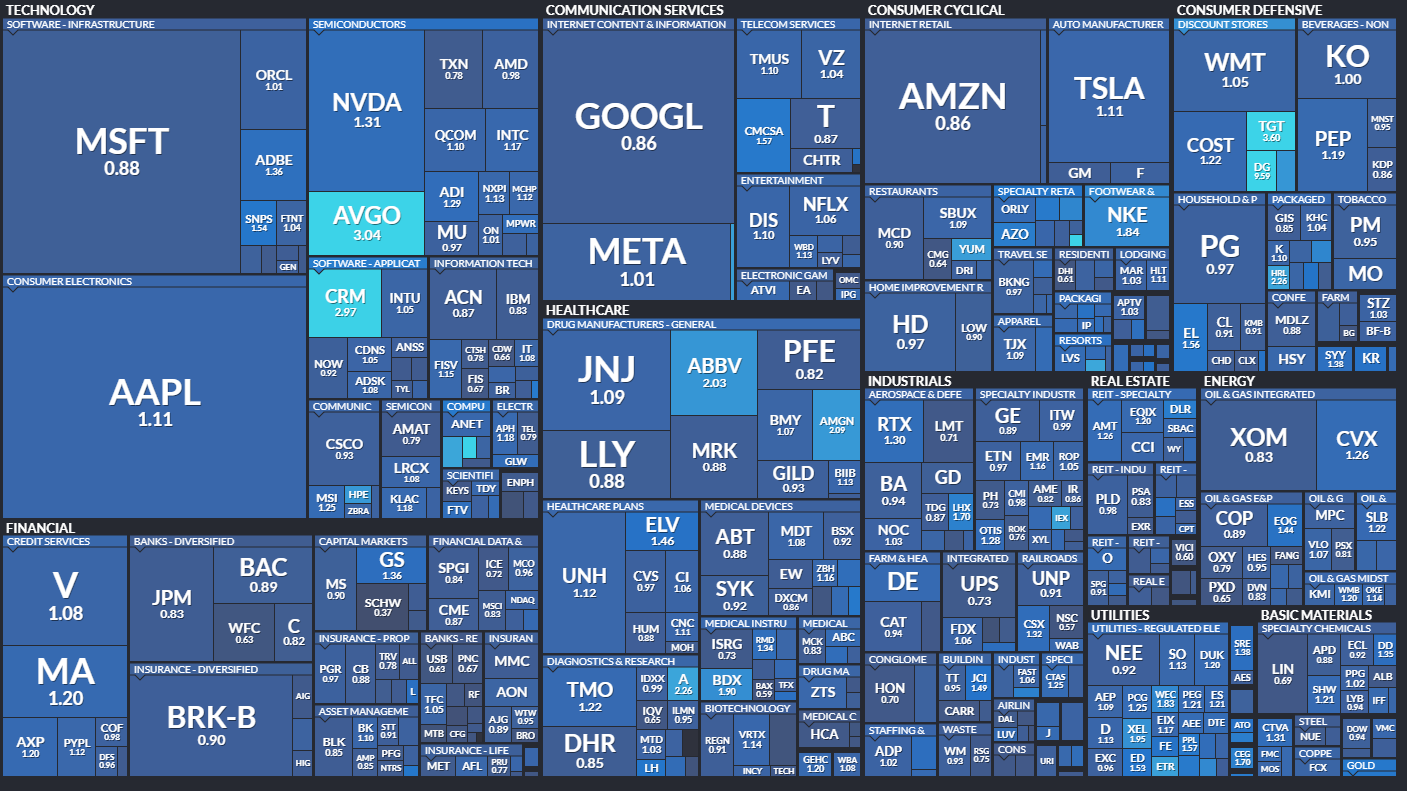
With just one glance, we can see where the market is putting its money.
Nvidia (NVDA) has been one of the hottest plays on Wall Street in recent weeks. Its relative volume – which is simply a measure of a stock’s current volume versus its long-term average – came in at 1.31.
Any figure above 1.0 means the stock is hotter than normal.
That’s good.
Right below it on the map, we see Broadcom (AVGO) is getting some love. Its trading volume is at three times its average. Investors want in. The stock has soared in recent days.
The action isn’t as hot for Exxon Mobil (XOM). Its 0.83 figure tells us demand is down. And, no surprise, so is the share price.
There are several things we can do with this information…
Little Work, Big Rewards
First, we can look for momentum plays. A stock in motion tends to stay in motion. By pinpointing plays with strong volume, we can look for the underlying catalyst and determine whether the action is coming because of a one-time event (perhaps an earnings pop) or if there’s something larger behind it (like Nvidia leading the AI charge).
A little homework here can lead to big rewards.
Volume often wanes just as quickly as it surges. An earnings report or some other headline-making news can send volume jumping… temporarily.
Identifying the stocks seeing these kinds of short-term bumps and playing their downside can be quite lucrative.
For the technically savvy, this technique can be used to spot price reversals. When a stock that has been falling suddenly sees a surge in buying pressure, it’s a good sign that the bottom is in and a rebound is on the way.
Finally, relative volume helps us understand the market’s sentiment toward a stock. A highflier that’s seen a large surge in volume may begin a manic sprint higher. It likely won’t last. But a stock that sees moderately rising volume and has its price trend upward with it is likely to keep rising.
A relative volume of about 1.5 to 2.0 tends to be a sweet spot for fast, reliable action.
For a speculative but often lucrative play, find stocks with high short interest. As buying volume jumps higher, the folks betting against the stock will be forced to add to the pressure.
It’s a recipe for a big boom.
But no matter what…
If volume isn’t part of your investing strategy… you’re doing it wrong.
It’s one of the simplest – yet most effective – indicators we’ve got.

Andy Snyder
Andy Snyder is an American author, investor and serial entrepreneur. He cut his teeth at an esteemed financial firm with nearly $100 billion in assets under management. Andy and his ideas have been featured on Fox News, on countless radio stations, and in numerous print and online outlets. He’s been a keynote speaker and panelist at events all over the world, from four-star ballrooms to Capitol hearing rooms.