Three Ways to Tell When Stocks Have Bottomed
Robert Ross|November 2, 2023
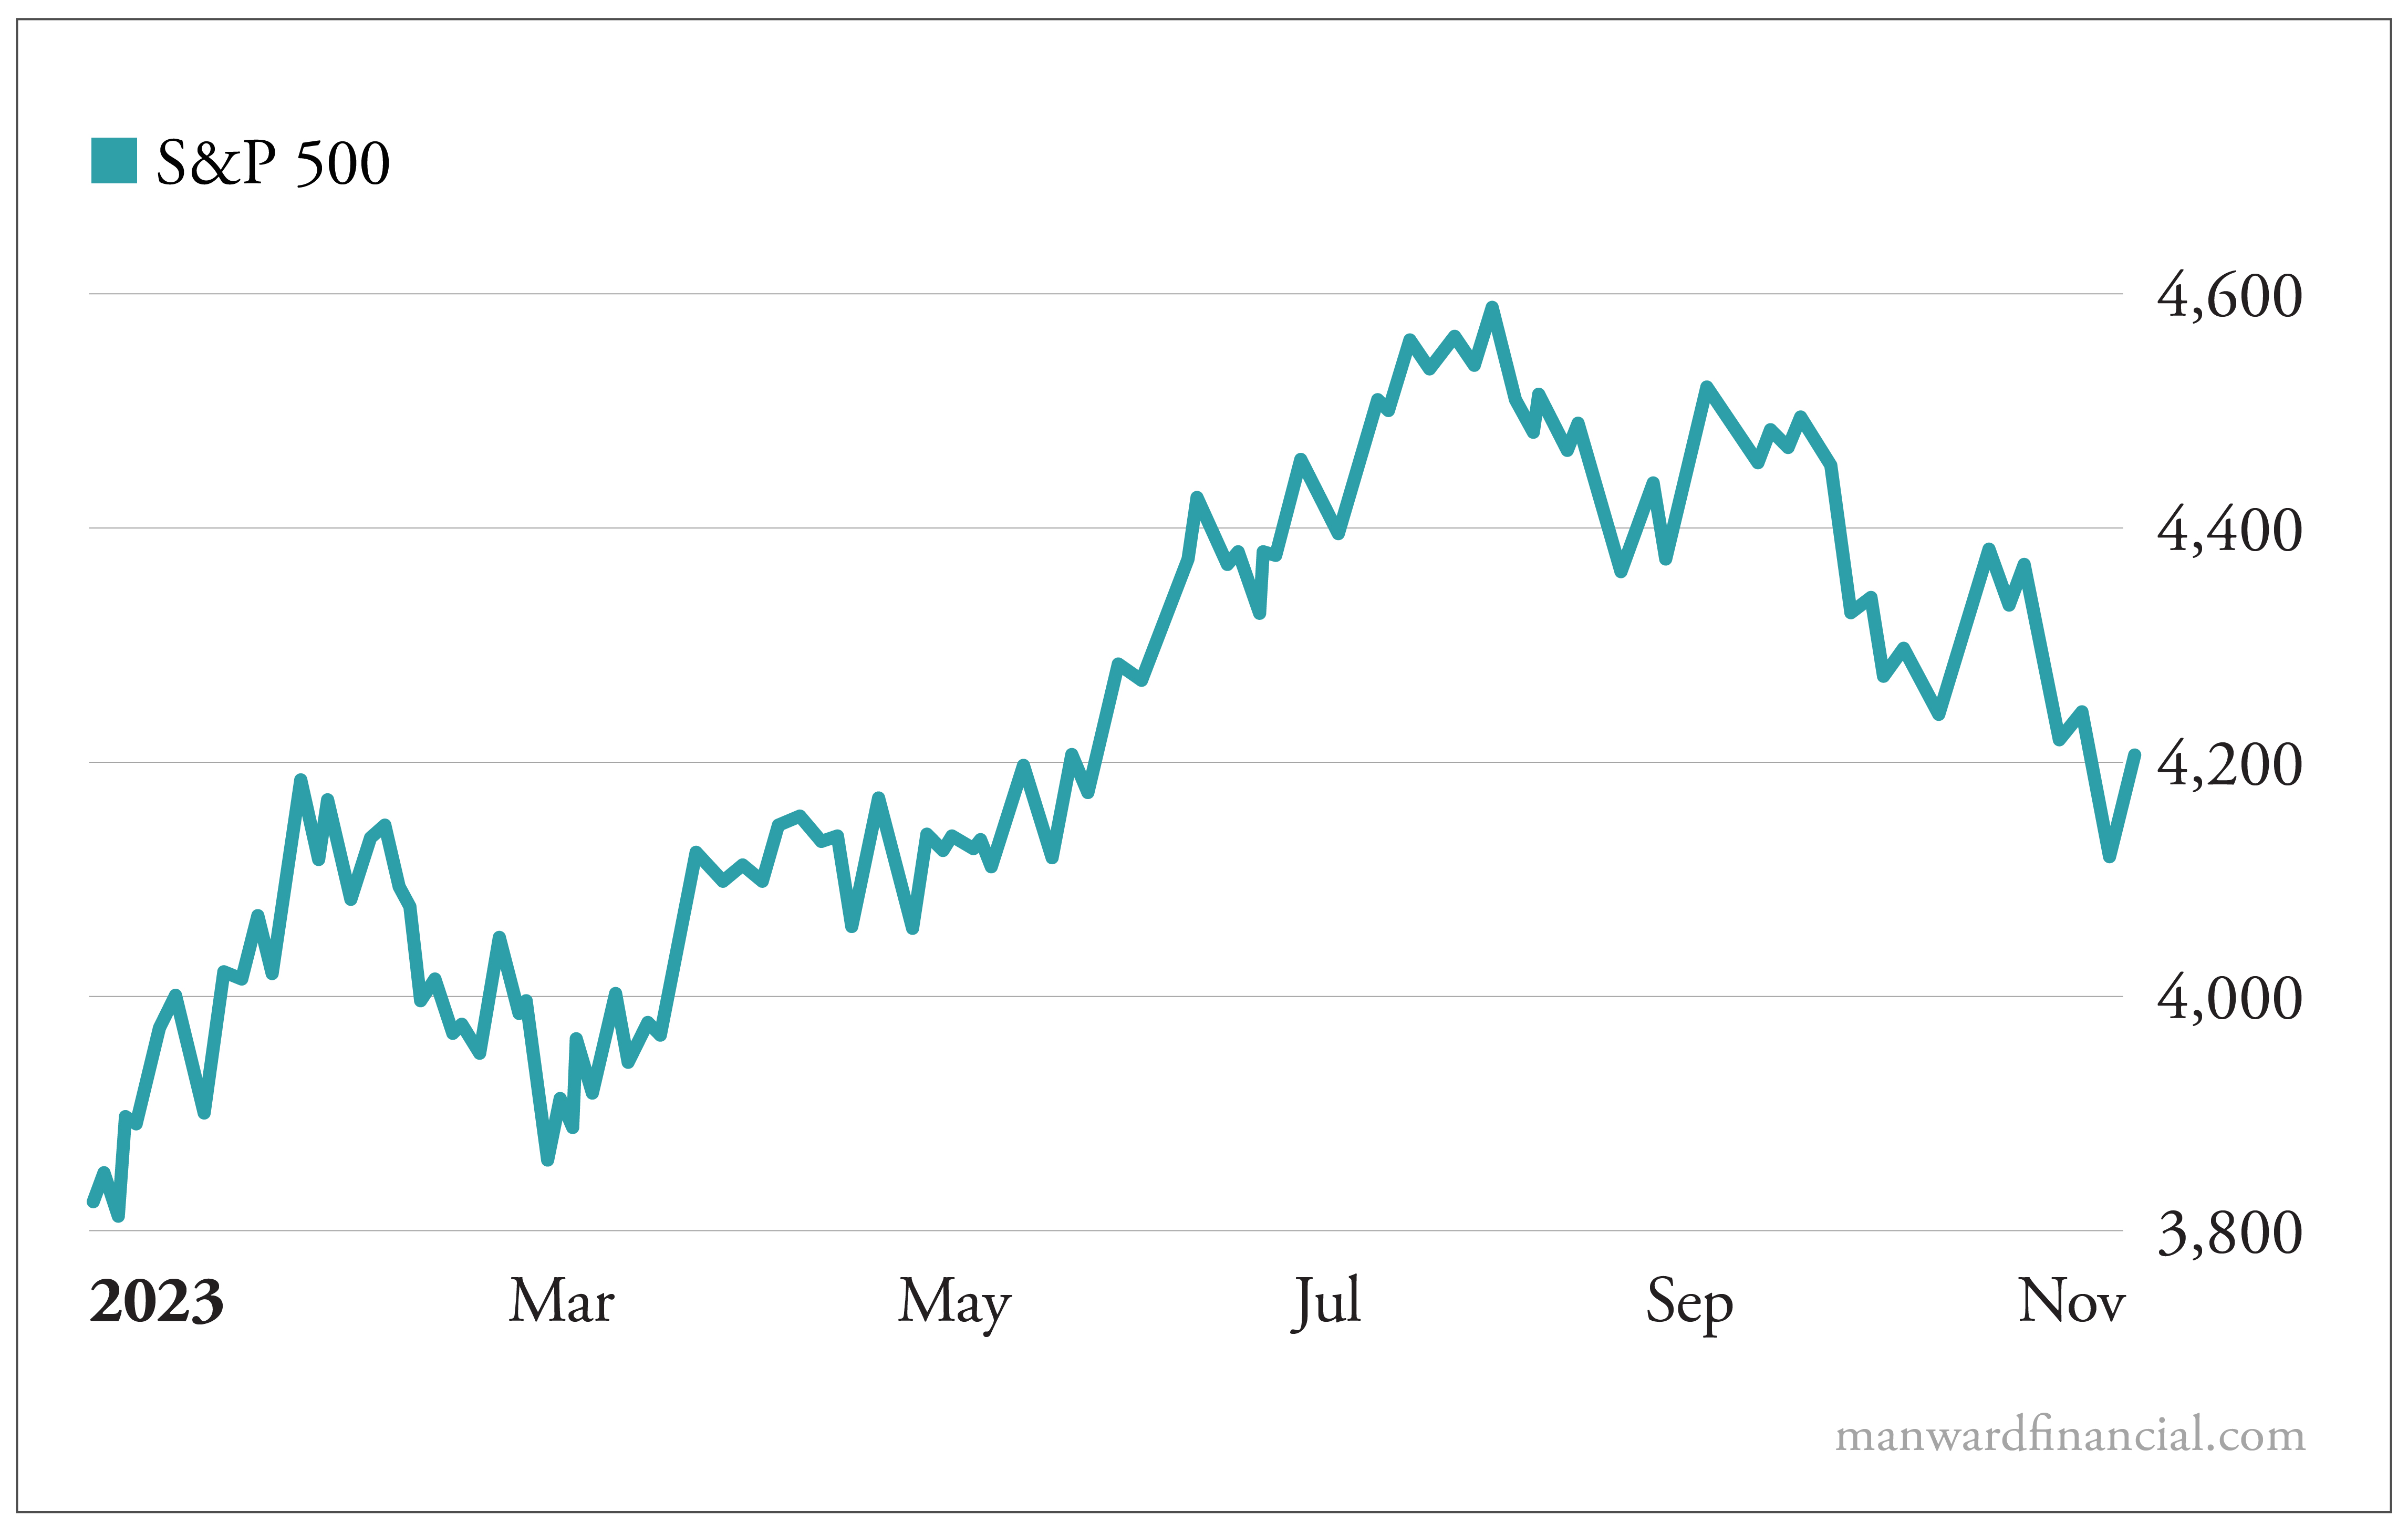
The S&P 500 is now in correction mode.
Thanks to weak earnings reports from Alphabet (GOOGL) and Meta Platforms (META), the main stock index has officially fallen 10% from its highs.
This has prompted lots of my followers to ask…
How do we confirm the market bottom?
It’s a good question… and while I’m not going to sit here and say you can time the market… you CAN look for certain signals that point to an upcoming shift.
And there are three factors I want to share with you today.
Let’s Get One Thing Straight
Now, most investors understand that markets correct from time to time.
But it’s often useful to put pullbacks into context.
For instance, the S&P 500 is now down 10% from its high in late July.
That’s the largest pullback it’s seen this year…
But this type of decline is very normal. A 10% intrayear decline has happened roughly once every 1.6 years on average since 1928.
And since 1980, the average S&P 500 correction has seen the index fall 14.3%.
Despite these pullbacks, over the long-term, the S&P 500 still returns 9% per year on average. Volatility is a feature, not a bug. And it’s why we are compensated with higher long-term returns.
But knowing when a pullback will end can make you a lot of money.
Indicator No. 1: A Peak in Bond Yields
Rapidly rising yields are bad news for stocks. Higher interest rates make investments like Treasurys more attractive. Because while stocks return 9% per year on average, many investors will forgo that additional 4% annual gain for the safety of a guaranteed 5% return.
High bond yields also make it much more expensive for companies to finance their operations. This hits smaller companies much harder than large ones, since they often need to borrow more capital to fund growth.
So a peak in rates – which billionaire investor Bill Ackman thinks may have happened – would be a boon for stocks.
Indicator No. 2: Peak in the U.S. Dollar
At the start of the year, the U.S. dollar was weakening relative to international currencies.
This was a tailwind for stocks at the time. But since the summer began, the U.S. dollar has strengthened, which has put pressure on stocks for a few reasons…
First, a stronger U.S. dollar makes American goods and services more expensive for foreign buyers. This can hurt the earnings of U.S. companies that rely on overseas markets for a substantial portion of their revenue.
Many of America’s largest companies fall into this category, including Apple (AAPL), Microsoft (MSFT) and Nvidia (NVDA). When foreign demand for American products decreases due to higher costs, it can lead to reduced profits and, consequently, a decline in stock prices.
Second, many U.S. multinational companies derive a significant portion of their revenue from foreign markets. A stronger dollar means that foreign earnings convert into fewer dollars, which can negatively impact financial results and, again, stock prices.
Lastly, a stronger dollar can prompt the Federal Reserve to raise interest rates in an effort to combat inflation. While it appears the Fed is finished raising rates this cycle, continued strength in the dollar may prompt it to take further action.
A weak U.S. dollar is a good sign we’ve reached a bottom.
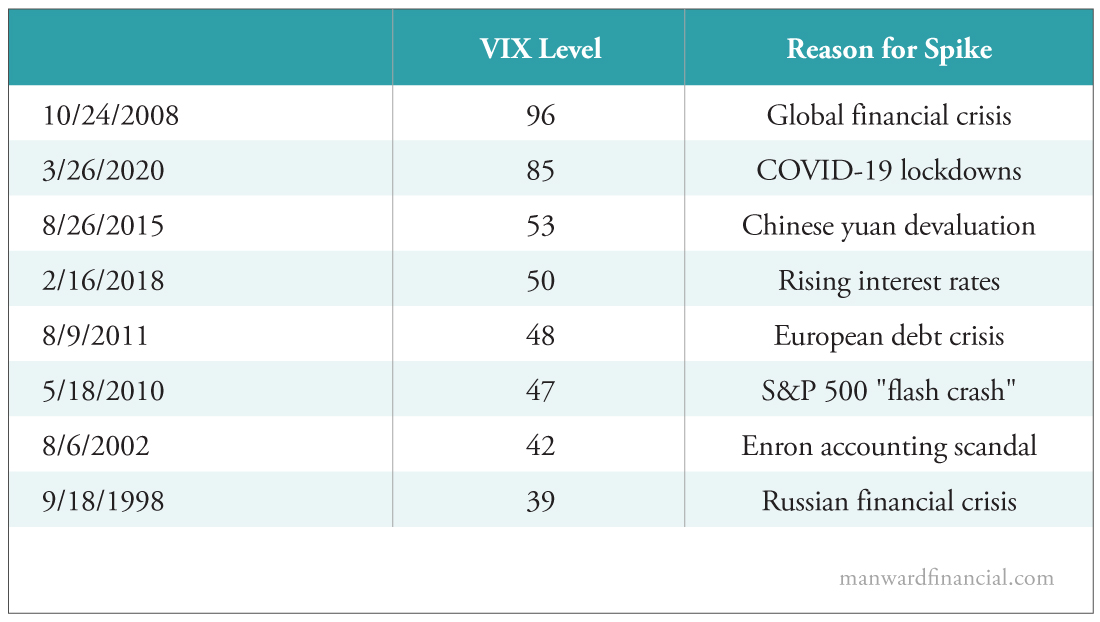
Indicator No. 3: A VIX Spike
Investors measure volatility using the CBOE Volatility Index. It’s also known as the VIX or the “Fear Index.”
When market fears are high, the VIX spikes.
Remember how scary things were during the beginning of COVID-19 lockdowns? They triggered the second-highest VIX reading in history…
There will be more VIX spikes in the future. And while they’re uncomfortable in the moment, the data shows these spikes are the best times to buy stocks and can signal a market bottom.
One-year S&P 500 returns have been positive 100% of the time after the VIX has spiked above 40 (except in 2008). In fact, the S&P 500 has nearly doubled its average one-year gain after these VIX spikes.
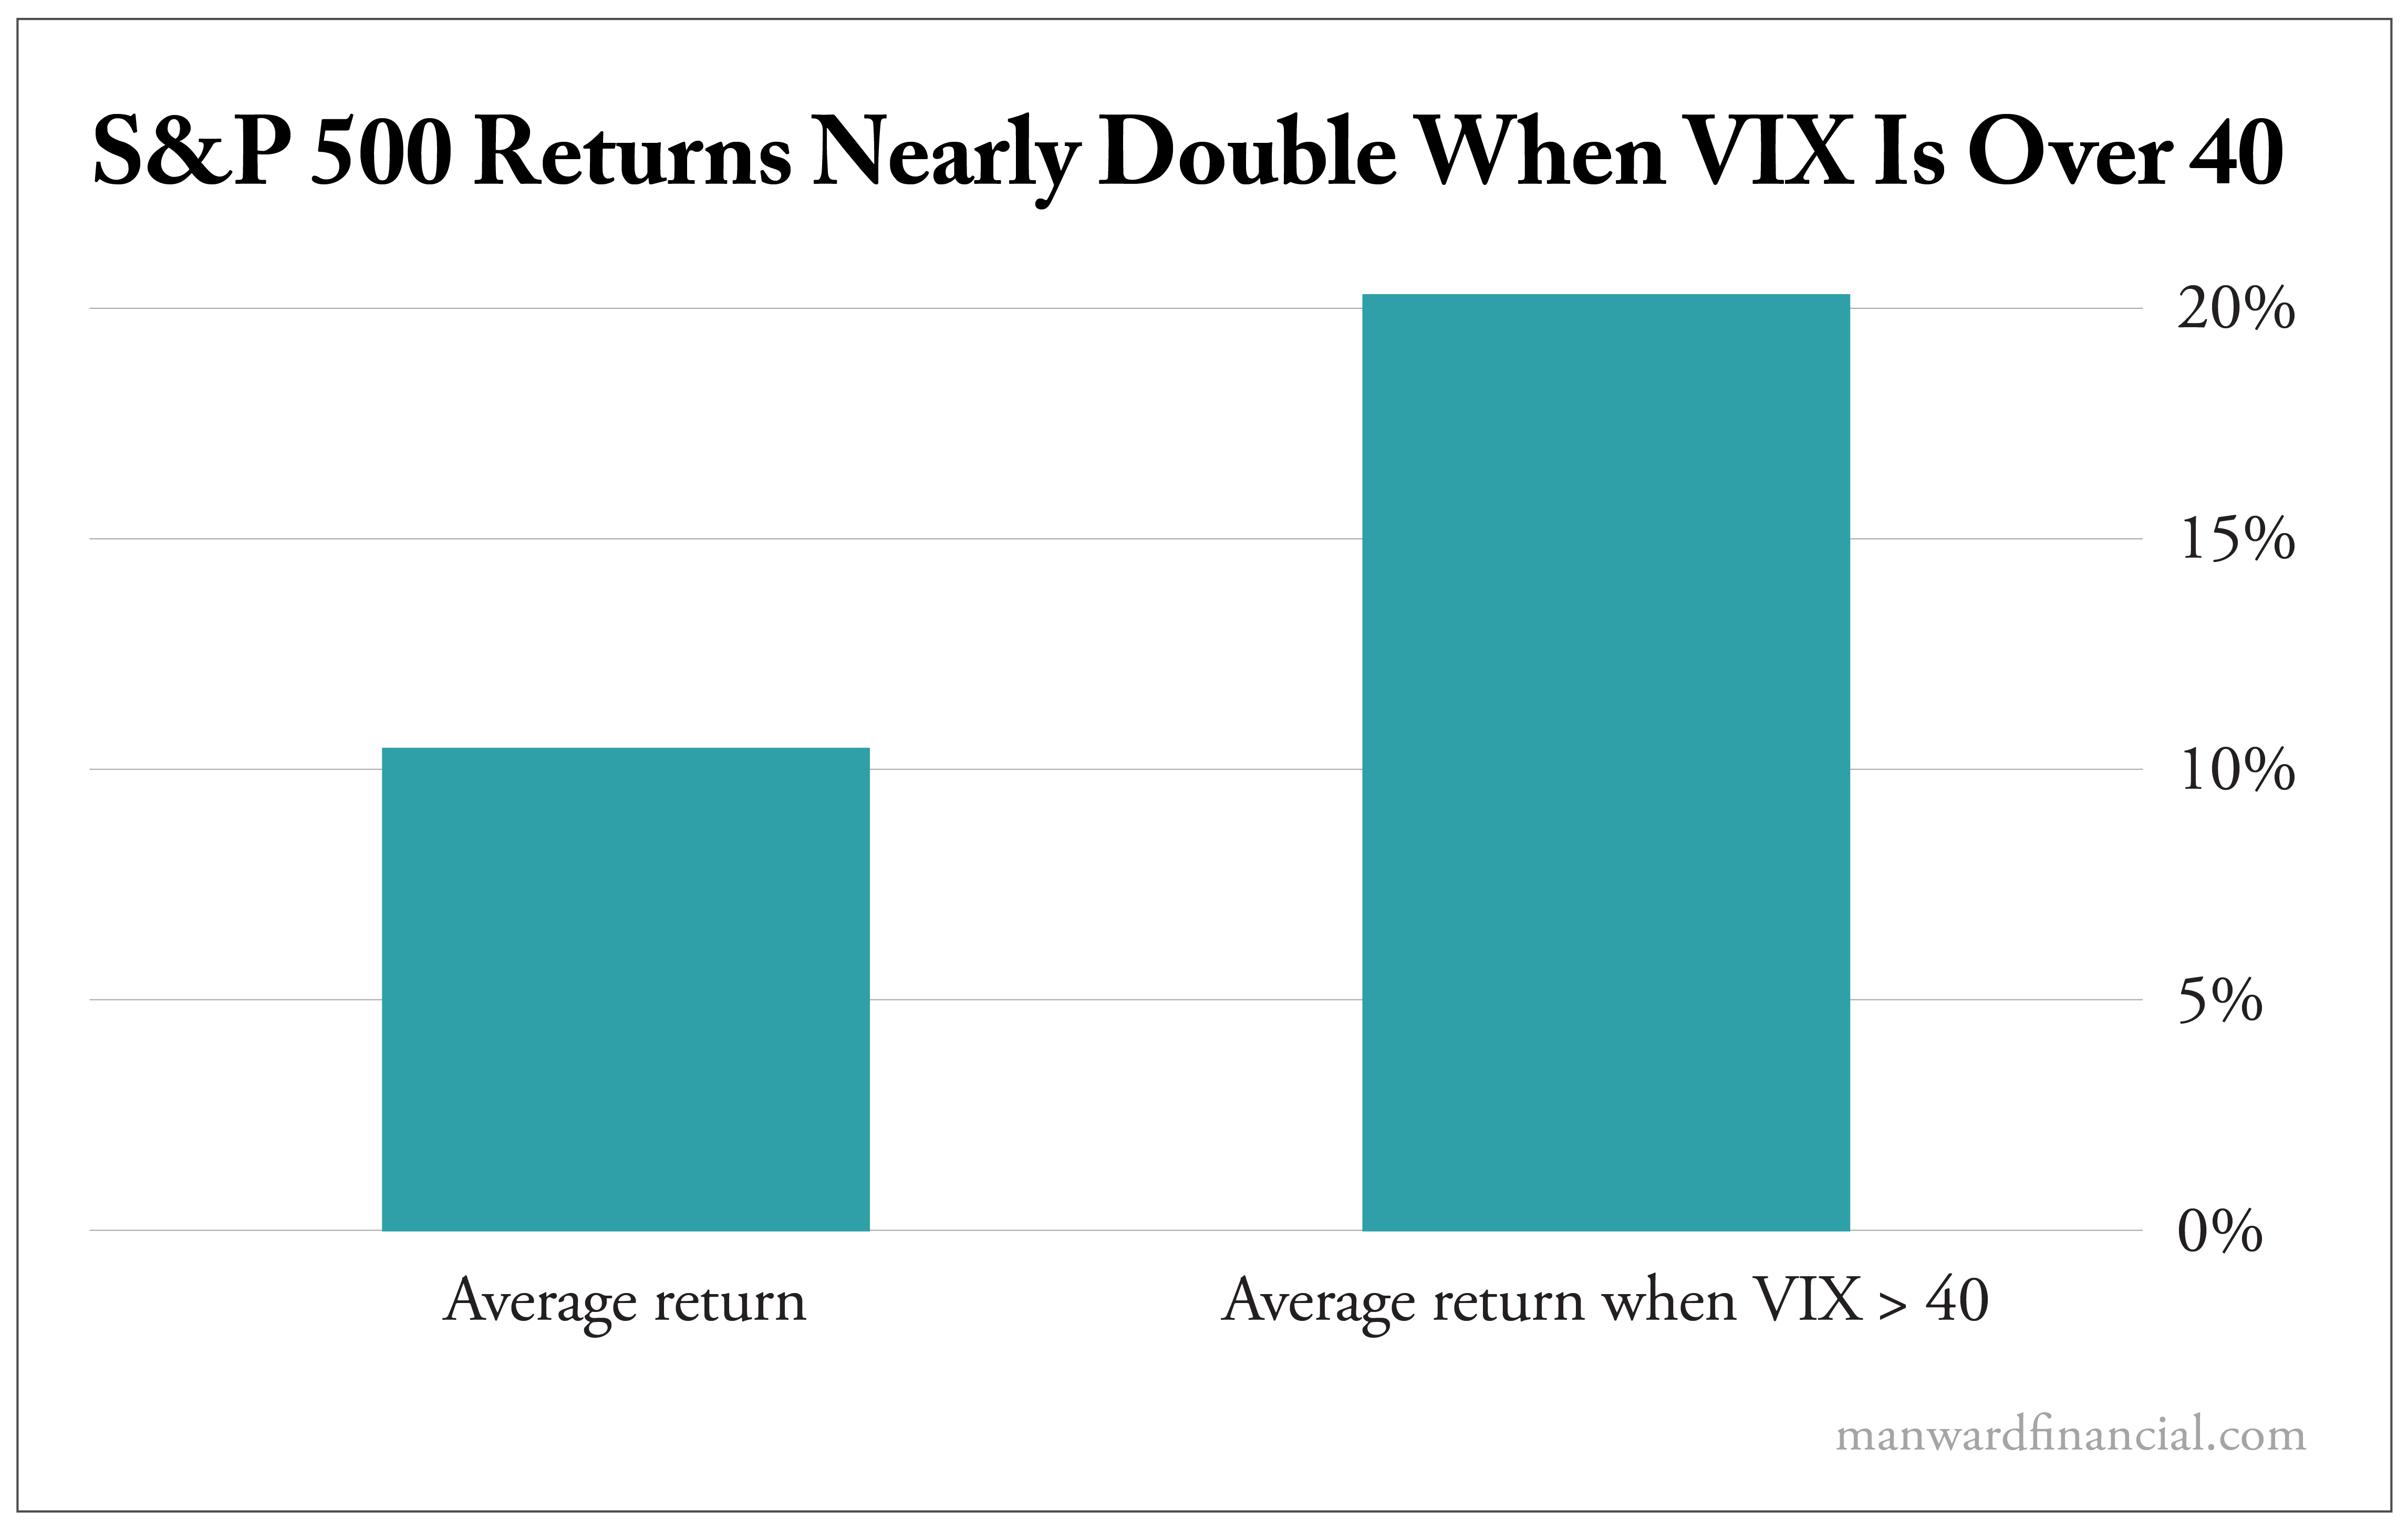
Now, I’m not saying we’re going to get a VIX spike above 40 during this pullback. But I will look at the VIX to gauge how fearful investors are.
Because in my career, I’ve made the most money when investors are losing their heads and selling indiscriminately.
And I’ll be ready to strike if that happens again.

Robert Ross
Robert Ross’s unique style of clear and direct stock research helped him build a massive following in the investment research industry, starting his career at investment research company Mauldin Economics and quickly rising through the ranks to become one of the youngest chief analysts in the industry. Today, over a million investors turn to Ross every month for his take on investing, economics, and personal finance. He now shares his unique insights in Total Wealth and Manward Money Report.